Temperatures and average rainfall in Brazil depending on the region and month
With this application we can have a basic idea of the climate that awaits us in a certain region of Brazil according to each month, additionally it also offers the monthly average of historical rainfall millimeters for each of the main destinations of each region.
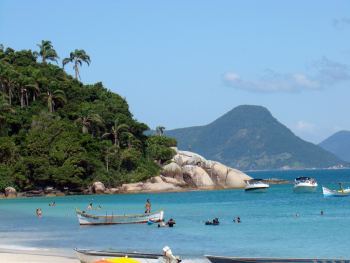
Campeche Island - Florianópolis
photo by Rodrigo Soldon - CC 2.0 by
To obtain the data it is necessary to choose the month in which we would like to know the weather and after a few seconds we will see the values of maximum, minimum and corresponding rain temperatures.
Botafogo beach in Río de Janeiro
photo by philliecasablanca - CC 2.0 by
The table was separated detailing the main cities of each subregion, sufficiently separated from each other to cover most of the Brazilian maritime coast.
Salvador de Bahía
photo by fhmolina - CC 2.0 by
Bearing in mind that the climatic variations of the historical averages are tiny among nearby cities or of the same sub-region. We can say that the values for Florianópolis can be taken as approximate also for Camboriú or for Laguna(much farther south in the same state of Santa Catarina) since the variations between these destinations are not significant. The same happens with the data from Rio de Janeiro, which can be considered similar in destinations in the most tropical part of Brazil, ranging from the north coast of San Pablo (Ubatuba, Ilhabela ...) until State of Rio de Janeiro ( Trindade , Ilha Grande , Buzios ...)
Playa de Boa Viagem en Recife, Nordeste de Brasil
photo by josemurilo - CC 2.0 by
As you can see in the tables of each month the values are very linear and consistent with the geographical position: towards the north the variations between maximum and minimum temperatures are scarce even in winter months, and to the south the cold predominates during July and August. On the map of Brazil you will be able to see the geographical location of other destinations, and have a basic idea of its climate by its proximity with the main destinations that have their historical climate shown in the table: Florianópolis , Rio de Janeiro , Salvador de Bahia , Recife and Fortaleza .
Iracema Beach in Fortaleza, Brazilian Northeast
photo by deltafrut - CC 2.0 by
Finally, these data come from several sources of historical data, and logically, can not be considered as absolutely accurate, especially considering that the current climate is quite unpredictable.
Anyway, we think they are very useful because they give a quick idea of how the climate varies in a given month between day and night(maximum and minimum temperatures), which places stay warm even during the southern hemisphere winter, and that regions are more rainy in each part of the year.
Weather in Brazil according to the month
Historical weather for this month (December)
Sections
Copyright
The articles published on this website are the intellectual property of their respective authors, who reserve all rights to them.
The images contained in this site are subject to the respective license and accreditation that accompanies them.
This website use Cookies Learn More


